Written by BuildZoom’s Chief Economist Dr. Issi Romem and Jack Cookson
There are many, many gun sellers in the United States. In fact, there are more than five times as many gun sellers as Starbucks locations, and four times as many as McDonalds restaurants. Not impressed? The number of gun sellers in the country is about the same as the number of elementary schools, and is about half the number of gas stations. The staggering number helps explain how 23 million guns were sold in the US in 2015 alone – approximately one new gun for every thirteen Americans.
We used public data on gun sellers – i.e. unique business locations of licensed gun dealers – to see how their number and geography has changed in the past few years. What we found was shocking.
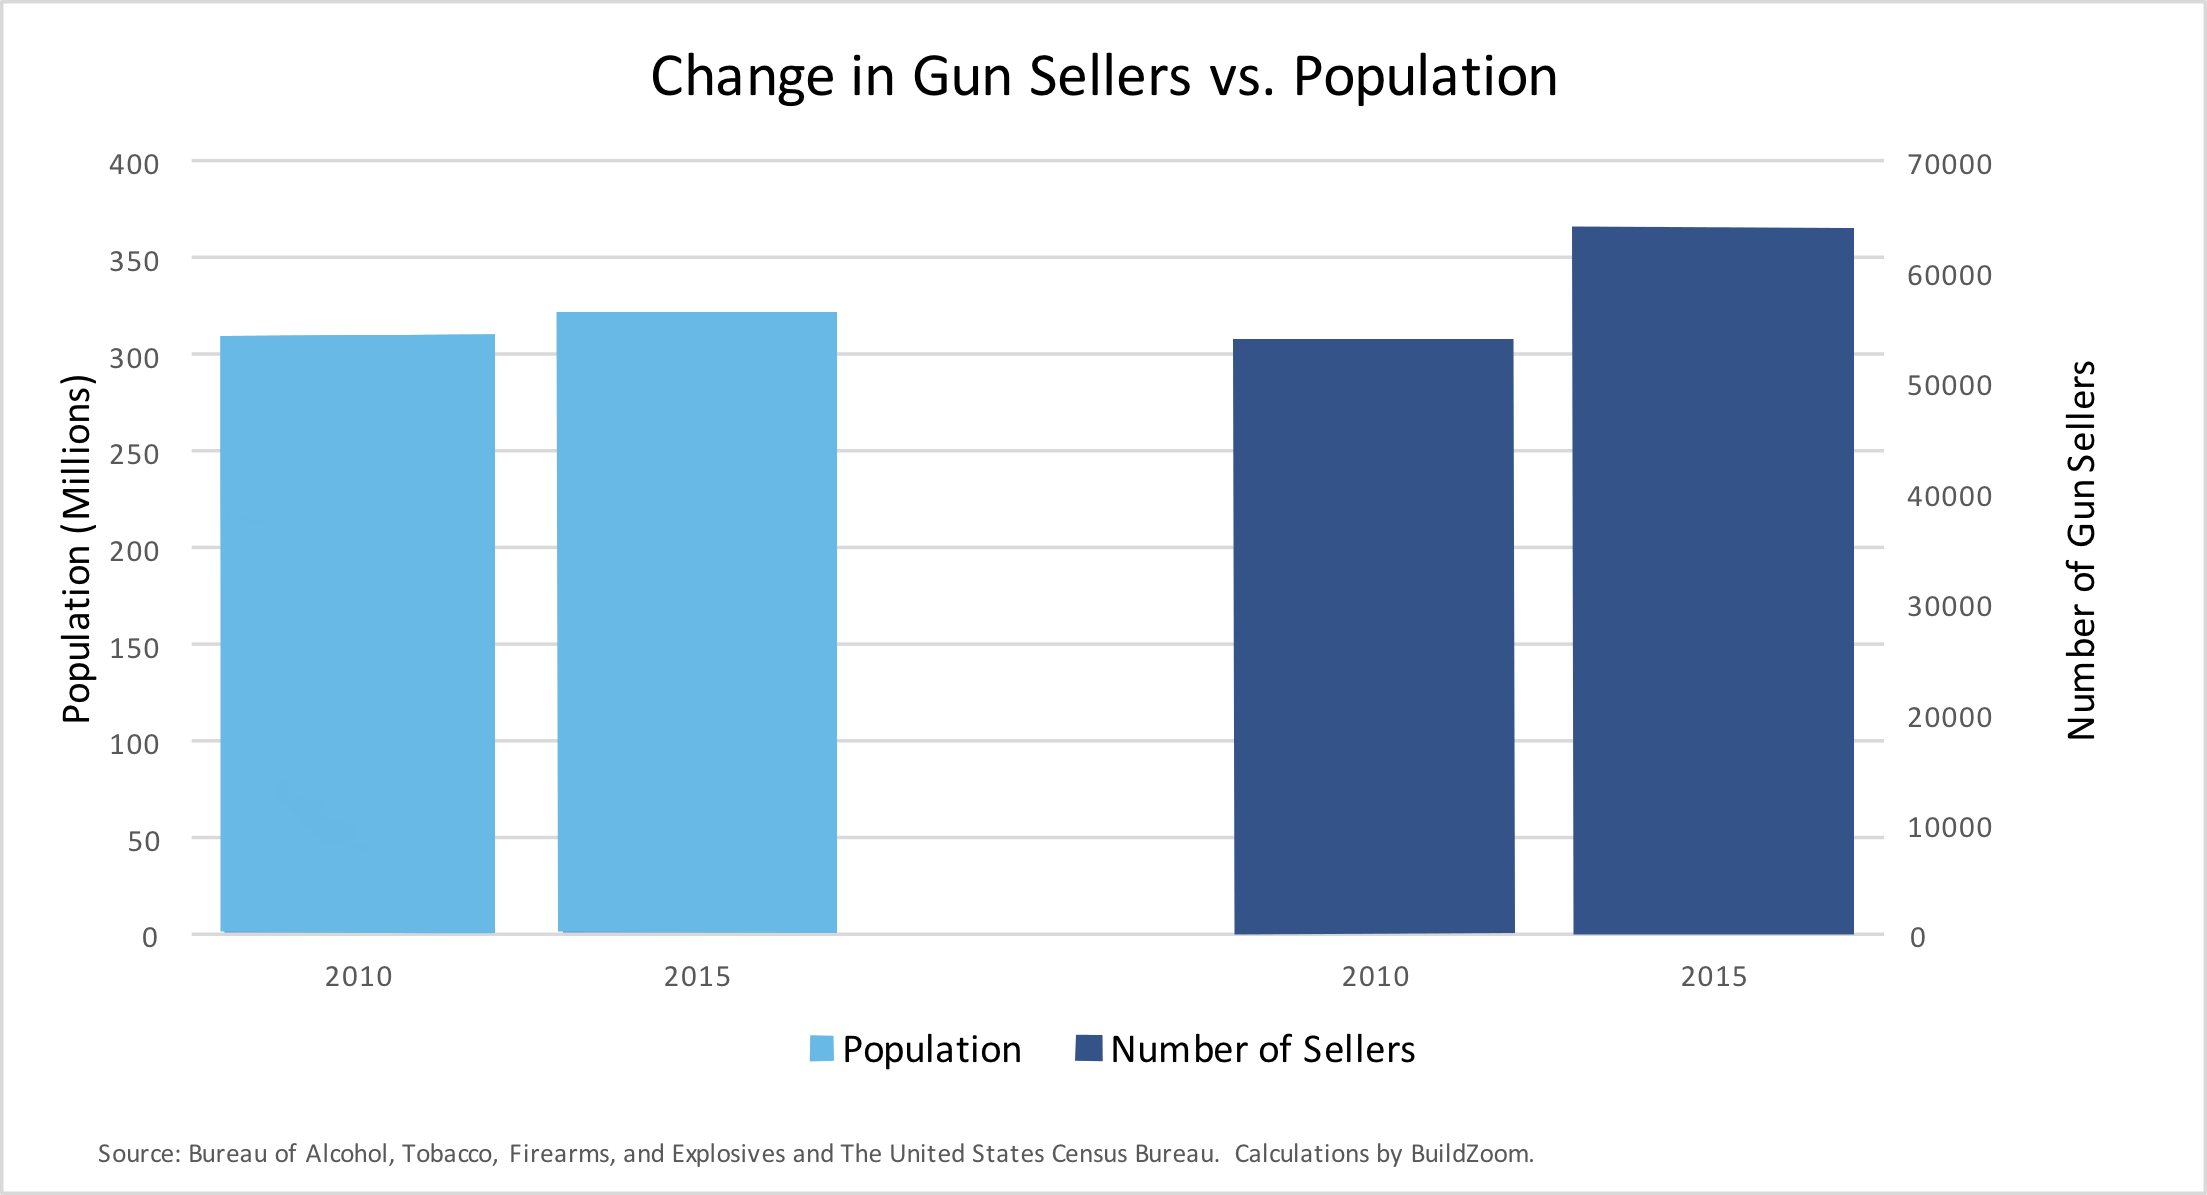
As of January 2010, there were 53,753 gun sellers in the US, which add up to 17.4 gun sellers for every 100,000 people. By December 2015 that number had jumped to 63,585, or more than 19.8 gun sellers per 100,000 people. That’s an increase of 13.8 percent in just under six years.
If that’s not enough to rock you, consider this. From January 2010 to December 2015, the US population increased by 3.9 percent, but over the same period the number of guns stores increased by 18.3 percent. That means the number of gun sellers grew 4.7 times faster than the population!
We knew the US was flush with gun sellers, but we didn’t realize the number was growing so fast.
The following map shows the increase in the number of gun sellers per capita by state (for a map of gun sellers per capita, as opposed to the increase thereof, see here).
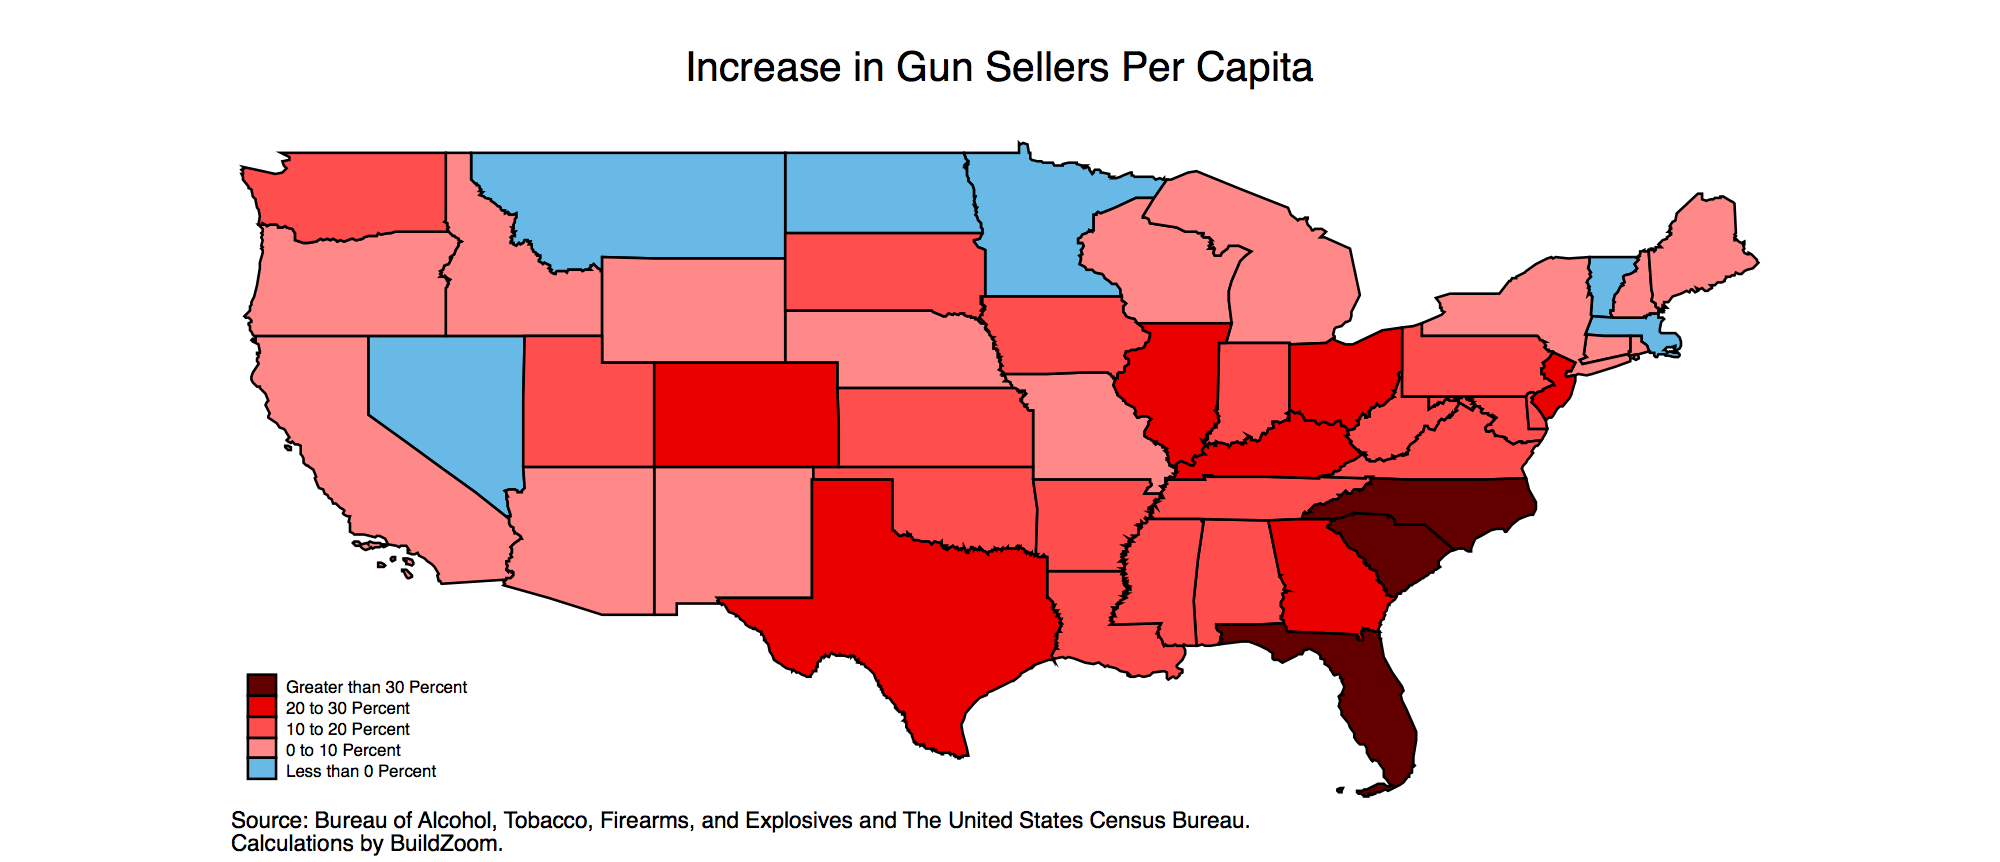
There are two important takeaways from the map:
- The increase took place across the board, with no fewer than 43 states showing an increase (the decreases in the remaining states were small).
- The increase is substantially greater as one shifts towards the southeast of the country.
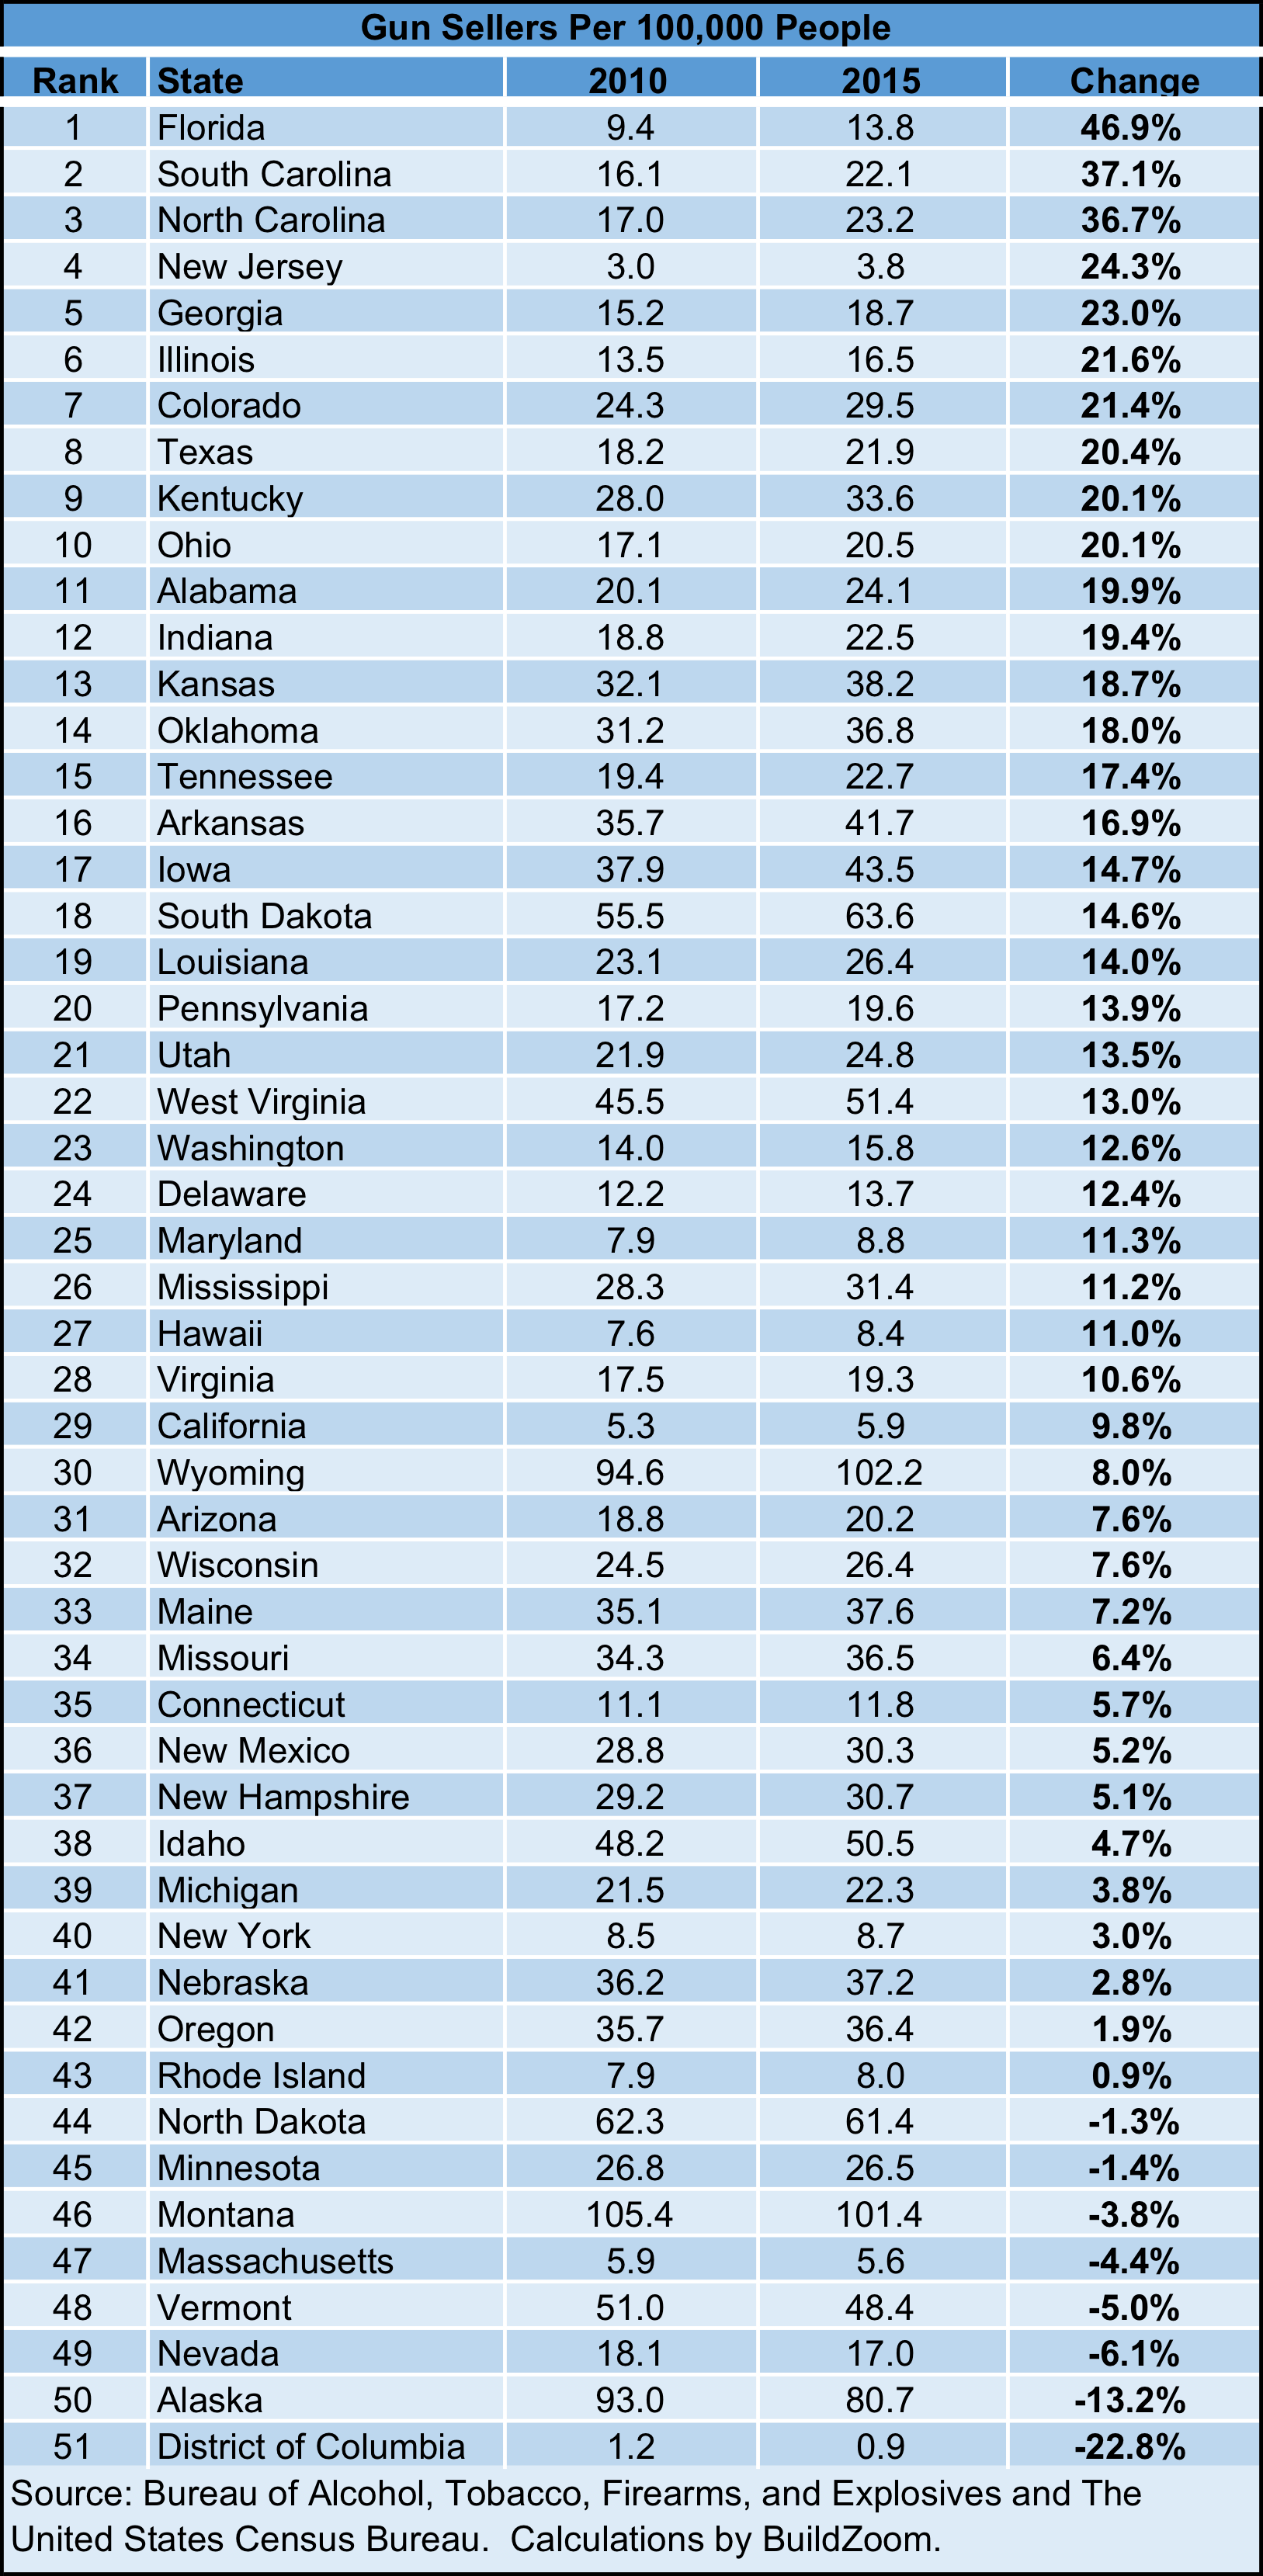
The table below reports the state-level numbers. The largest increase was in Florida, where gun sellers per capita increased 47 percent, followed by the Carolinas, with 37 percent increases. The largest state-level drop occurred in Alaska, where gun sellers per capita decreased 13 percent. Washington, DC, stands out with a decrease of 23 percent, but it should be noted that in the Washington metropolitan area gun sellers per capita increased by 27 percent.
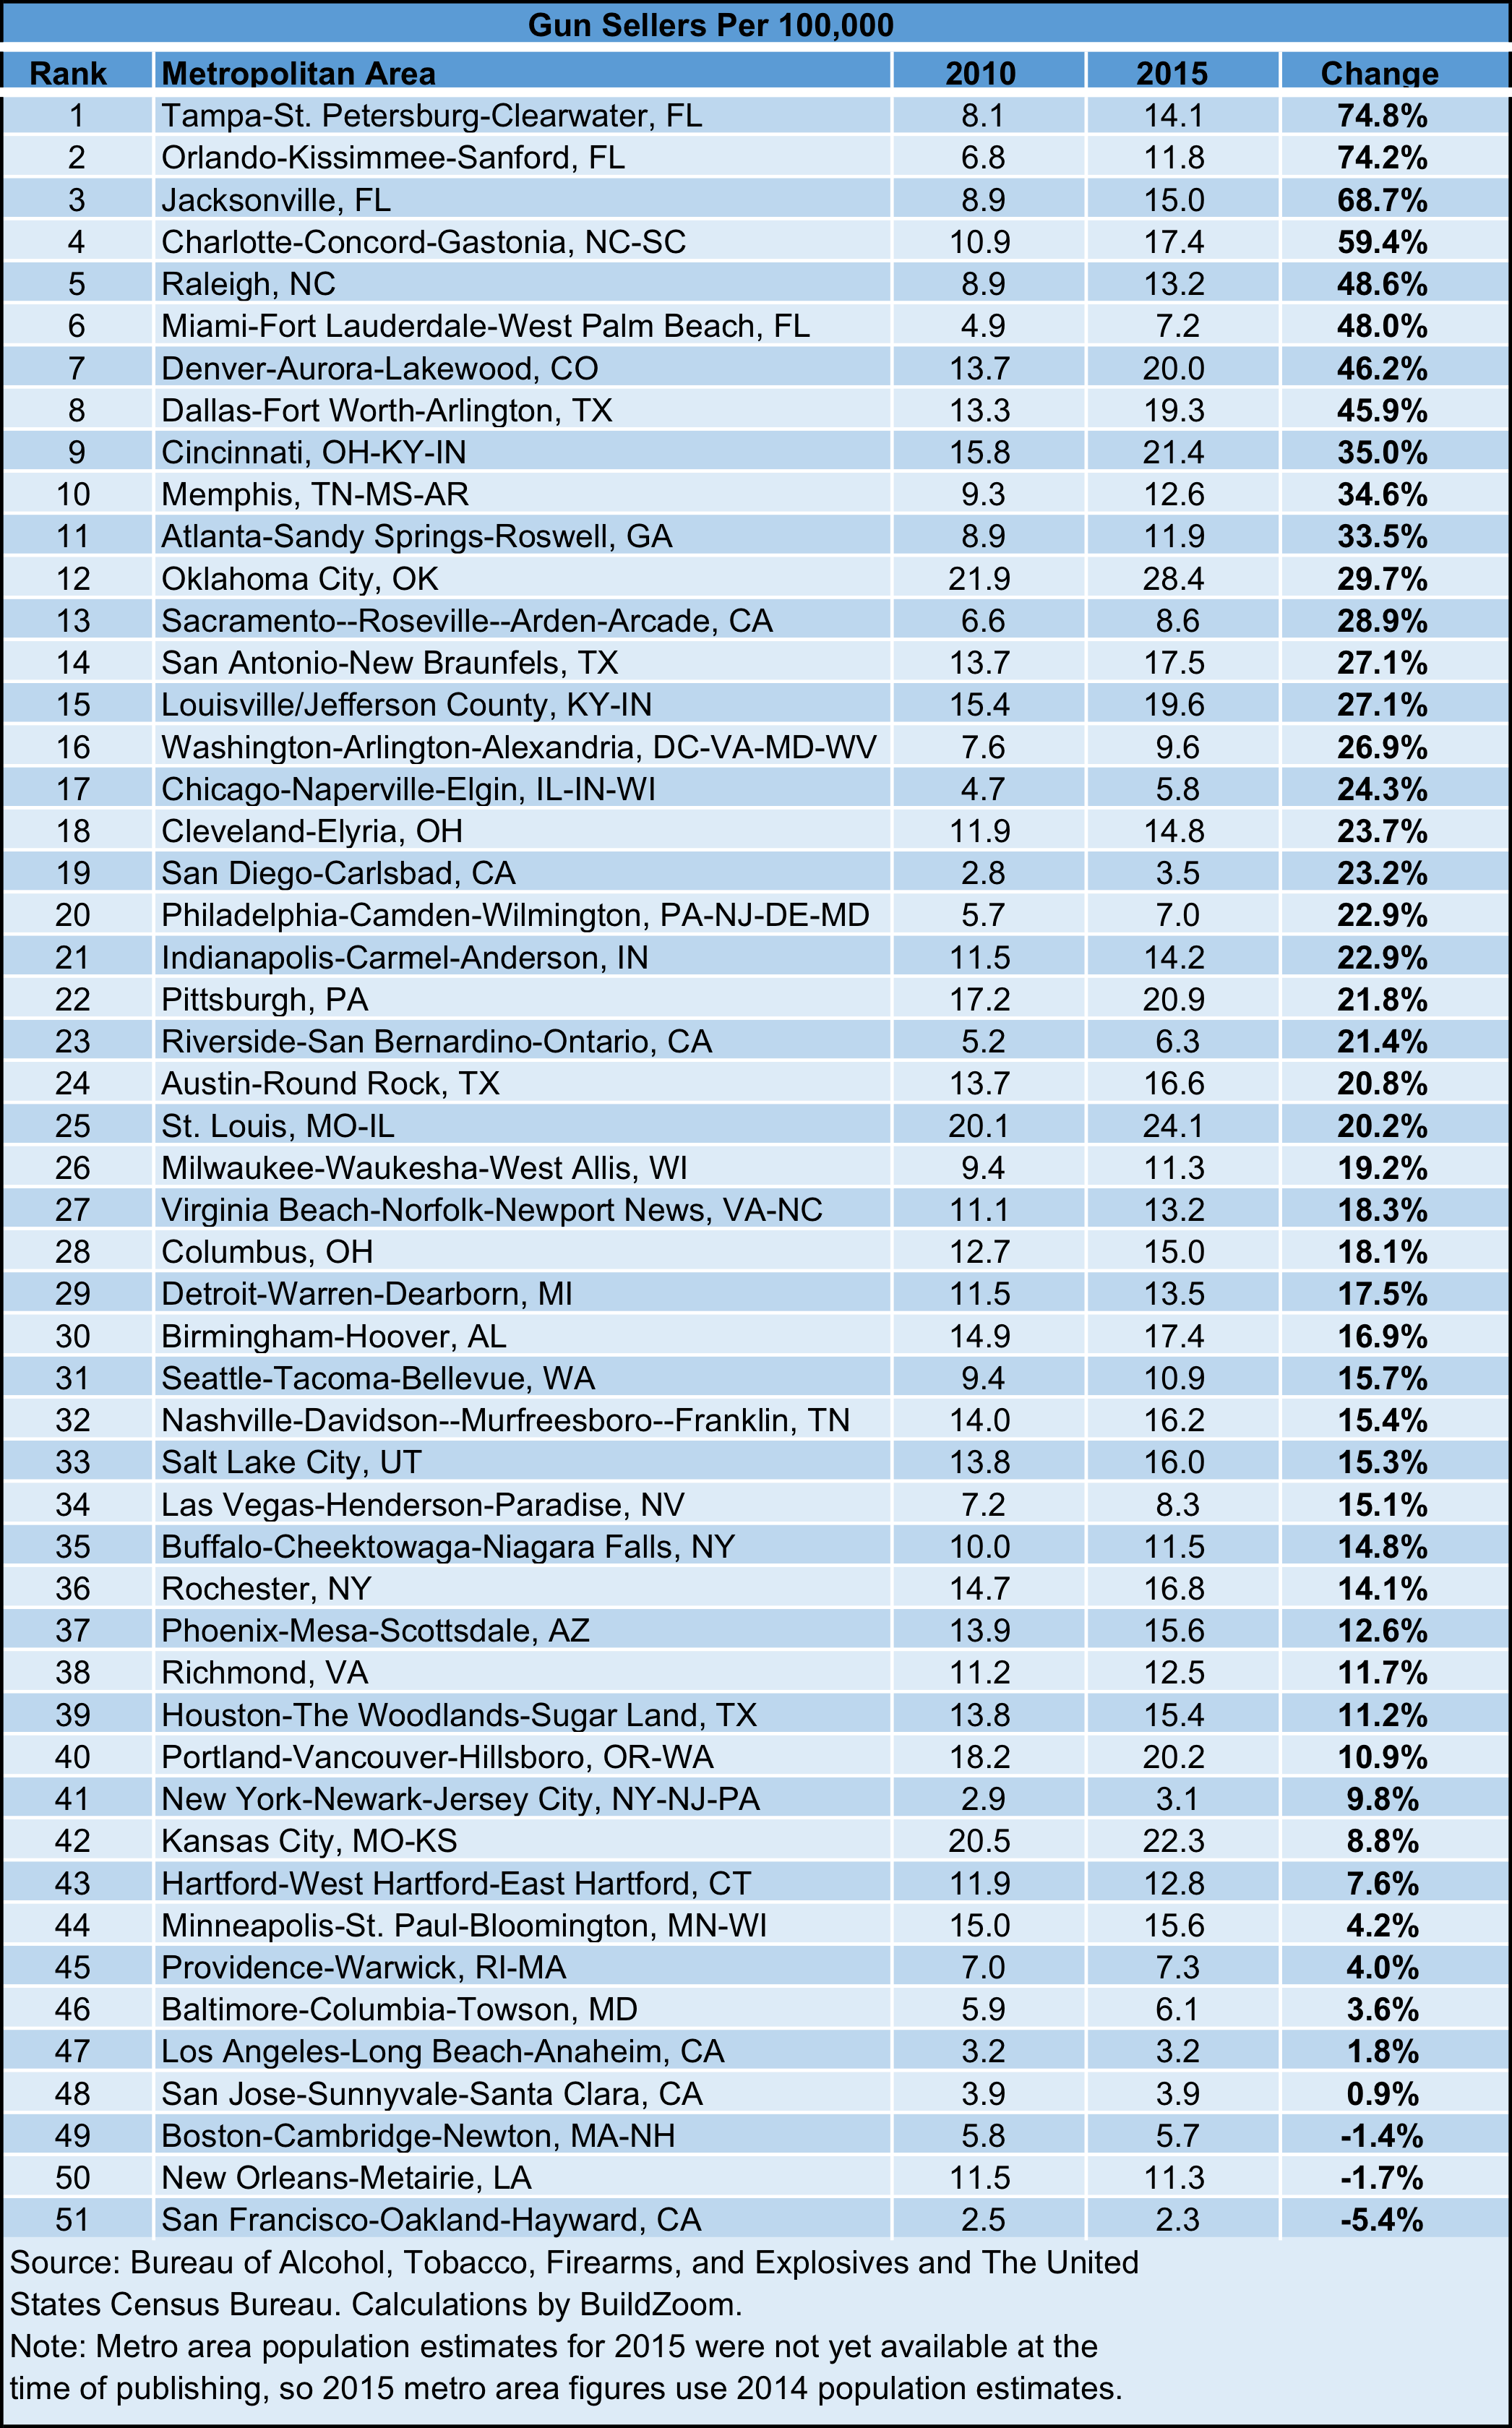
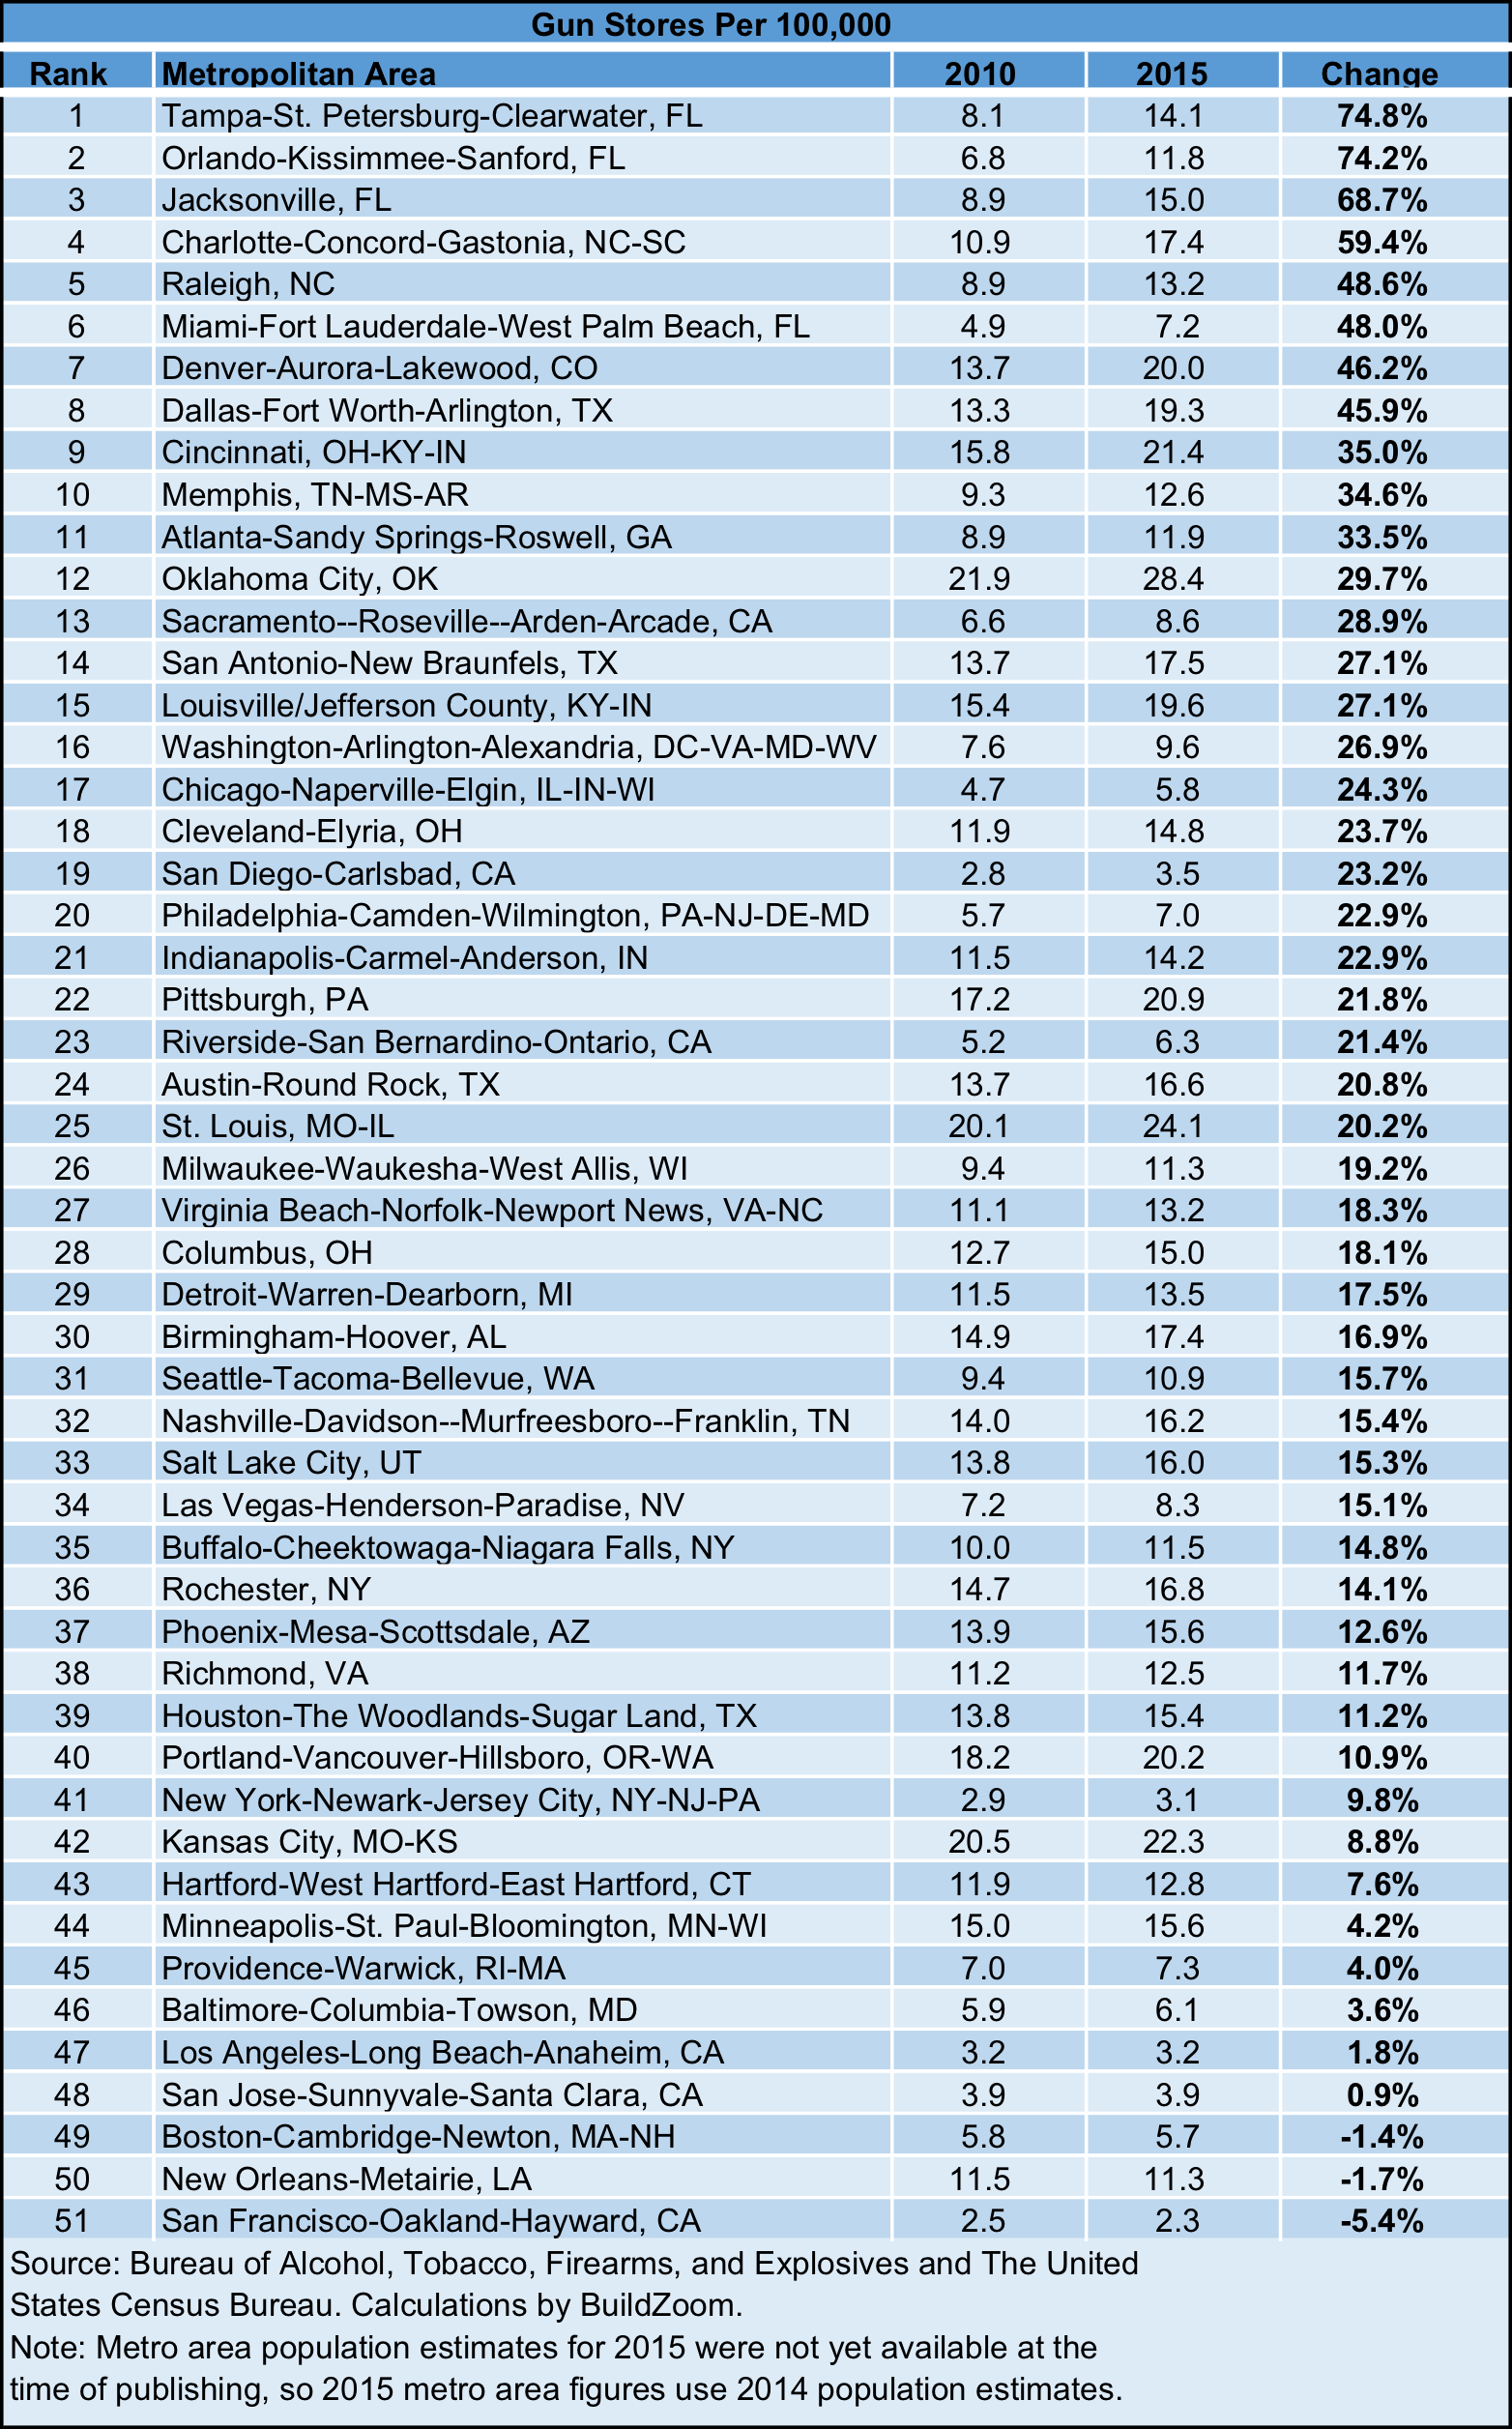
We also broke down the numbers by metro area. The table below reports the numbers for all metros with population over one million (as of 2010).
*** Note: on January 20, 2016, we modified the term “gun stores” in this article to “gun sellers,” in order to more accurately reflect the fact that not all locations associated with federal firearm licenses necessarily correspond to brick and mortar stores, although many of them probably do. For more details, see the updated methodology section, below. ***
Leave a Reply